
A ballbar test makes two axes of the machine move together to draw a circle, and measures how perfect that circle is. The result is a single plot. It may look complicated at first, but once you know a few things the plot tells you clearly what condition the machine is in.
In this article we read the plot of a test we made in the field, step by step. The plot is the output of the test software; nothing has been changed on it. The software was set to Turkish, so the labels in the image are in Turkish.
What is in the plot
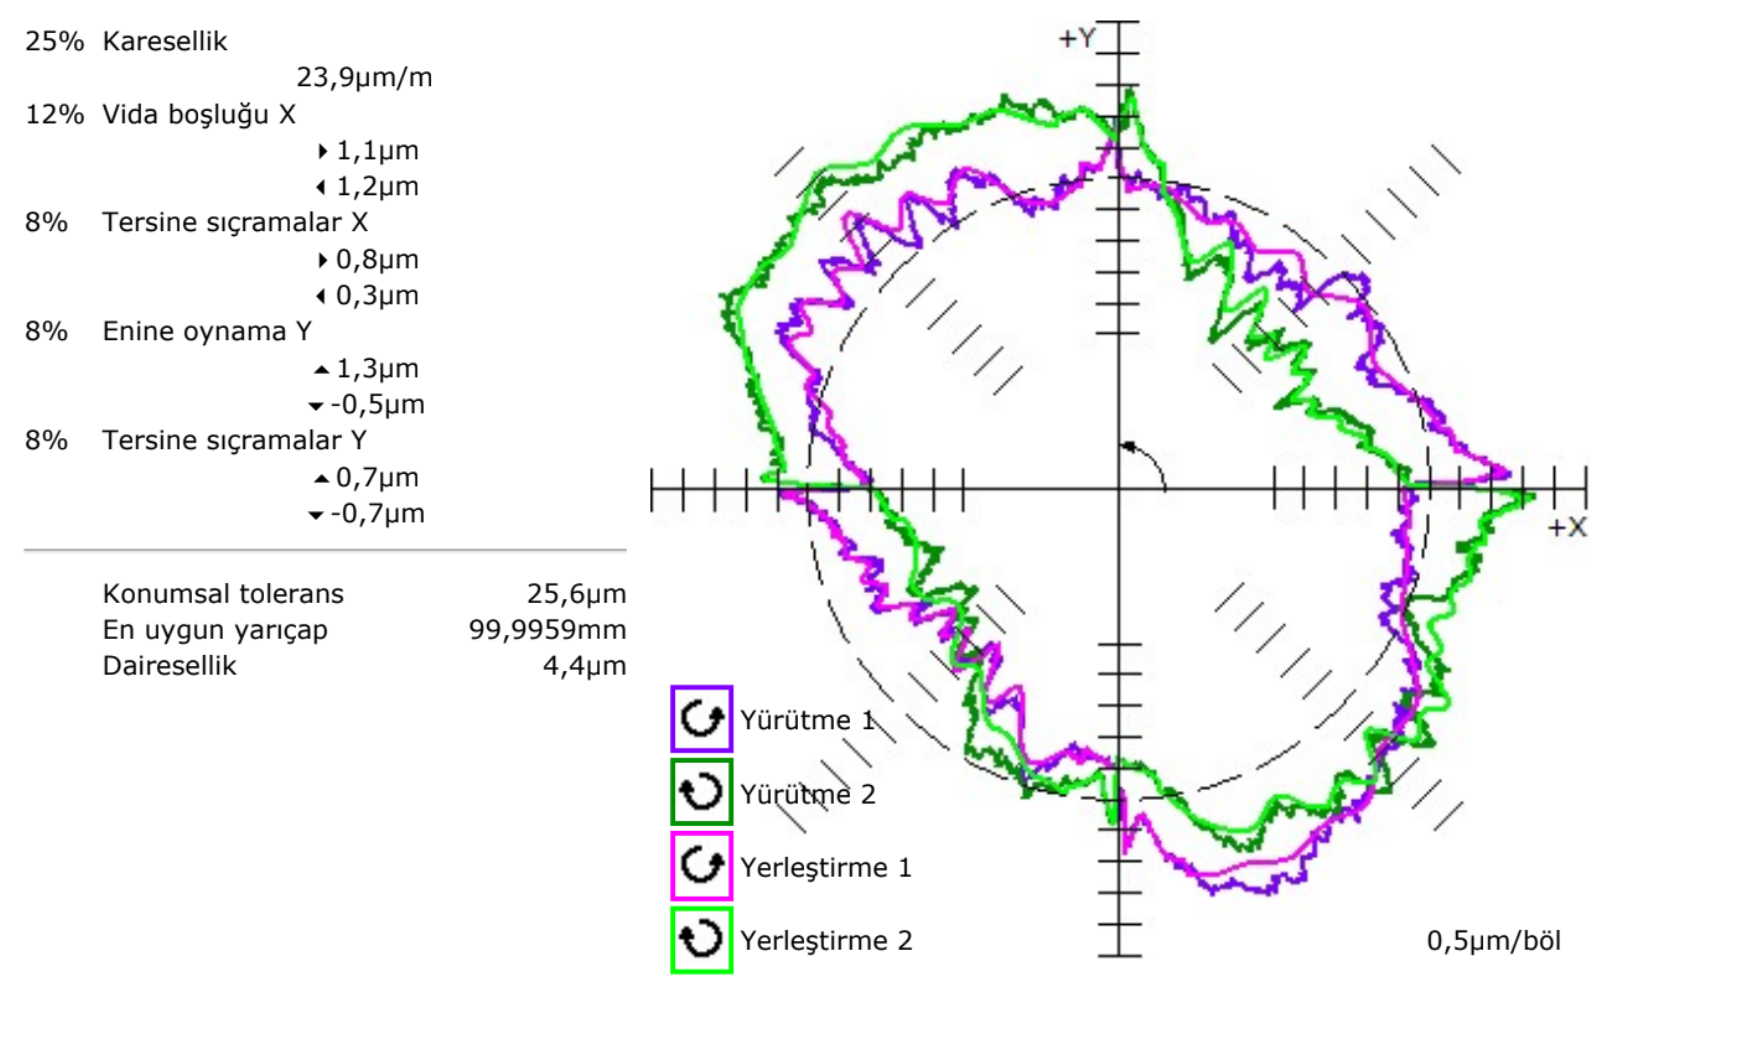
The two lines in the middle are the X and Y axes. The dashed circle shows the ideal circle the machine should draw. The coloured traces are the path the machine actually drew.
There is an important detail here: the traces are drawn magnified. The “0.5 µm/div” note at the bottom right says that each division in the plot corresponds to 0.5 micrometres. So the bumps and dips you see are on the scale of thousandths of a millimetre. A machine that draws what looks like a perfect circle to the eye shows all its faults in a ballbar plot.
The test is run in two directions: clockwise and anticlockwise. The legend shows which colour belongs to which direction. The difference between the traces in the two directions helps to tell backlash and servo problems apart.
The table on the left
The test software analyses the measured trace, separates the errors by type and ranks the contribution of each to the total error as a percentage. In this test the ranking is:
| Share | Error | Value |
|---|---|---|
| 25% | Squareness | 23.9 µm/m |
| 12% | Backlash in the X axis | 1.1 / 1.2 µm |
| 8% | Reversal spikes in the X axis | 0.8 / 0.3 µm |
| 8% | Lateral play in the Y axis | 1.3 / −0.5 µm |
| 8% | Reversal spikes in the Y axis | 0.7 / −0.7 µm |
This ranking shows which problem should be dealt with first. On this machine, by far the largest share belongs to squareness.
How the errors show in the plot
Squareness error. If the X and Y axes are not at exactly 90 degrees to each other, the circle turns into an oval tilted at 45 degrees. This is why the trace in this plot is stretched along a diagonal.
Backlash. When an axis reverses, play in the ball screw means it does not move for a brief moment. In the plot it shows as a step in the trace where the axis changes direction.
Reversal spikes. At a reversal, the servo system lags while it overcomes friction. In the plot these show as spikes on the axis lines; in this plot they are clearly visible at the right-hand end of the X axis.
Lateral play. Play in the guideways makes the trace shift sideways when the axis changes direction.
The values at the bottom
The values below the table summarise the test:
- Circularity 4.4 µm: The largest range of deviation of the measured trace from the circle that fits it best. It shows the combined effect of all errors as a single number.
- Best-fit radius 99.9959 mm: The radius of the circle that best fits the measured trace. This test was made with a 100 mm ballbar.
- Positional tolerance 25.6 µm: Another summary value reported by the software.
What to do with this result
The plot shows where the problem is. On this machine the squareness of the axes should be dealt with first; backlash and spikes have smaller shares. Then the position error of each axis is measured with laser calibration and compensation tables are entered. Finally the ballbar test is repeated, and the before and after results are compared and reported.
We explain how a ballbar test is done on the ballbar testing page.